前言
由于最近购入了 iPhone 13 Pro, 想测试一下高刷在各个应用上的适配情况. 一开始使用的 PerfDog 来做性能分析, 但是从9月开始这玩意就收费了, 而且起步价3000¥/3000分钟还不便宜. 个人使用仅20分钟配额, 实在不够. 那么在 iOS 上有没有其他方案对应用进行性能分析呢, 翻了下开发文档发现其实是有的, 不过操作比 PerfDog 麻烦不少, 这里简单记录下.
记录数据
准备工作
- 准备一台运行
macOS的设备(黑苹果也行) - 安装
Xcode - 保留一些磁盘空间(至少10G)
数据采集
打开 Xcode 从菜单选择 Xcode -> Open Developer Tool -> Instruments 打开 Instruments
Instruments 是一个强大而灵活的性能分析和测试工具, 是 Xcode 工具集的一部分. 它旨在帮助您分析iOS、watchOS、tvOS和macOS应用程序、流程和设备,以便更好地了解和优化它们的行为和性能。
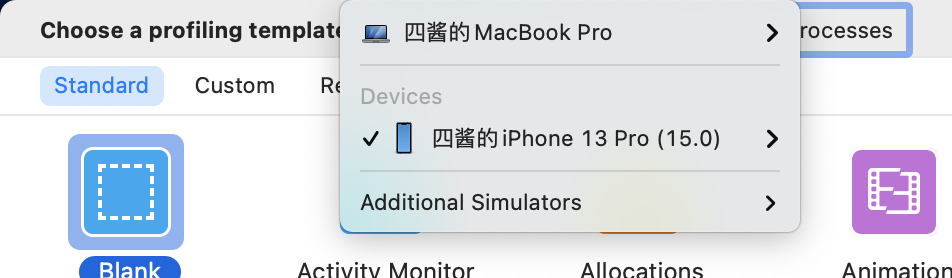
选择目标设备 -> All Processes, 应用商店下载的应用是无法针对进程单独调试的.
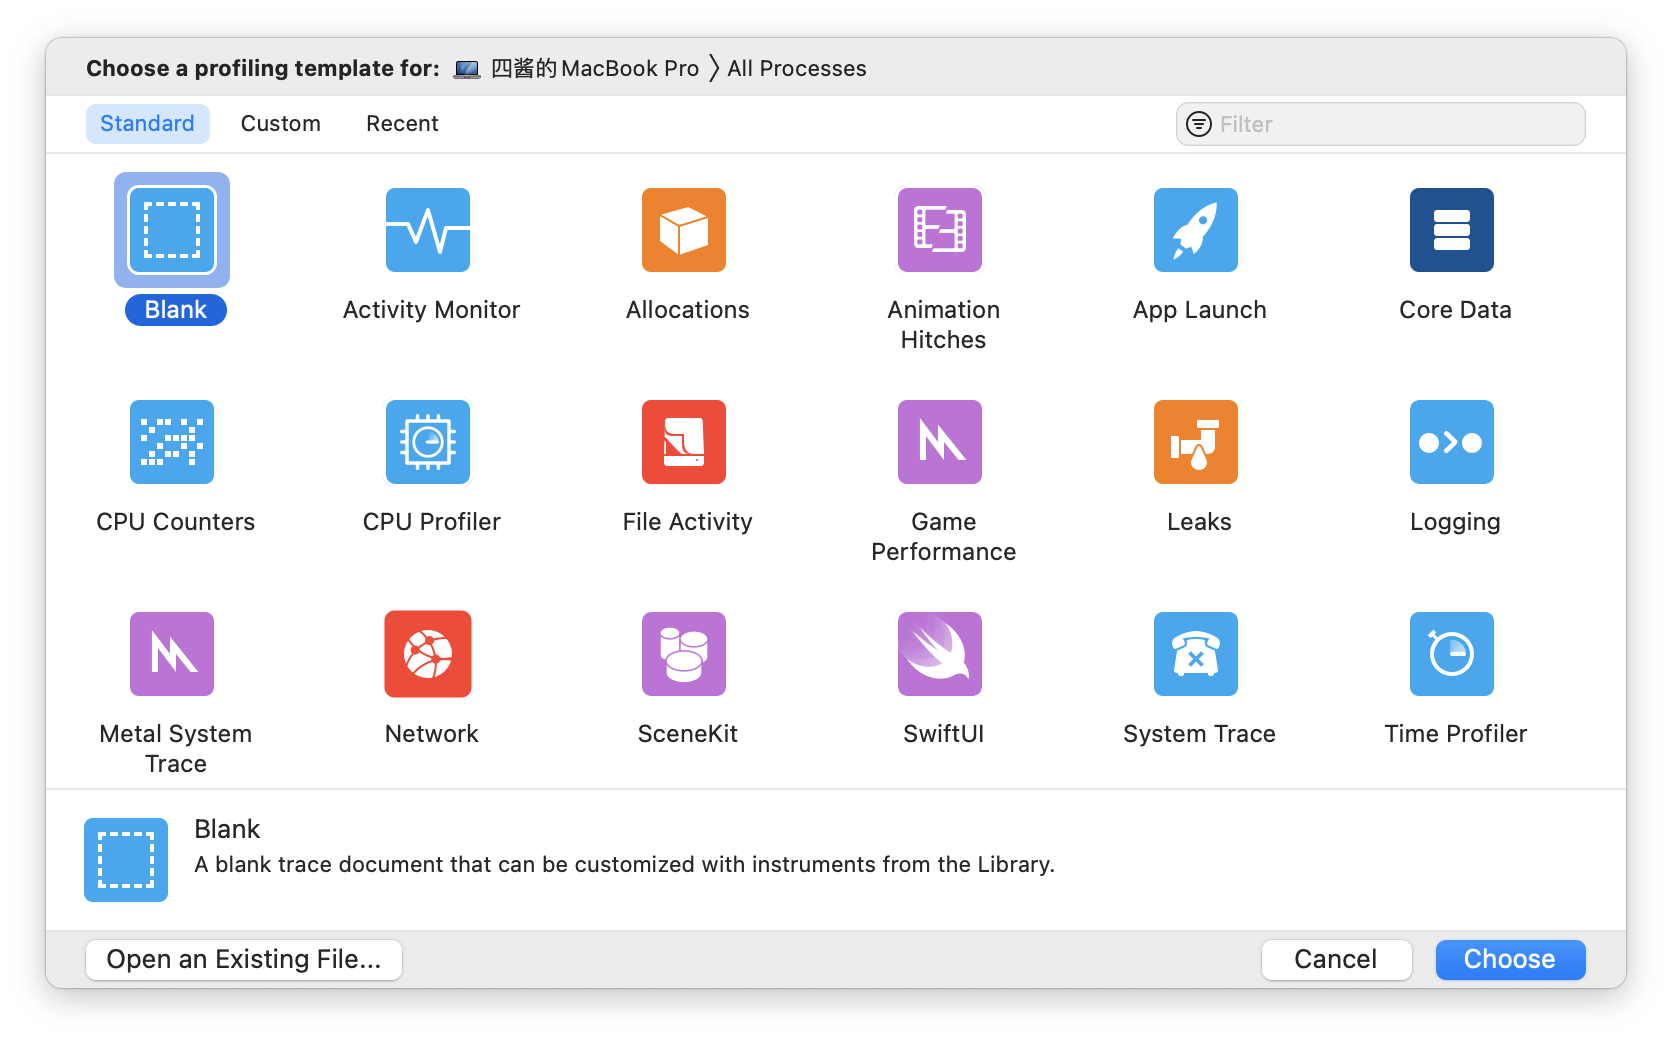
打开一个空白模板 (Blank), 选择 View -> Show Library 或按下 command + L 并选择一个想要的
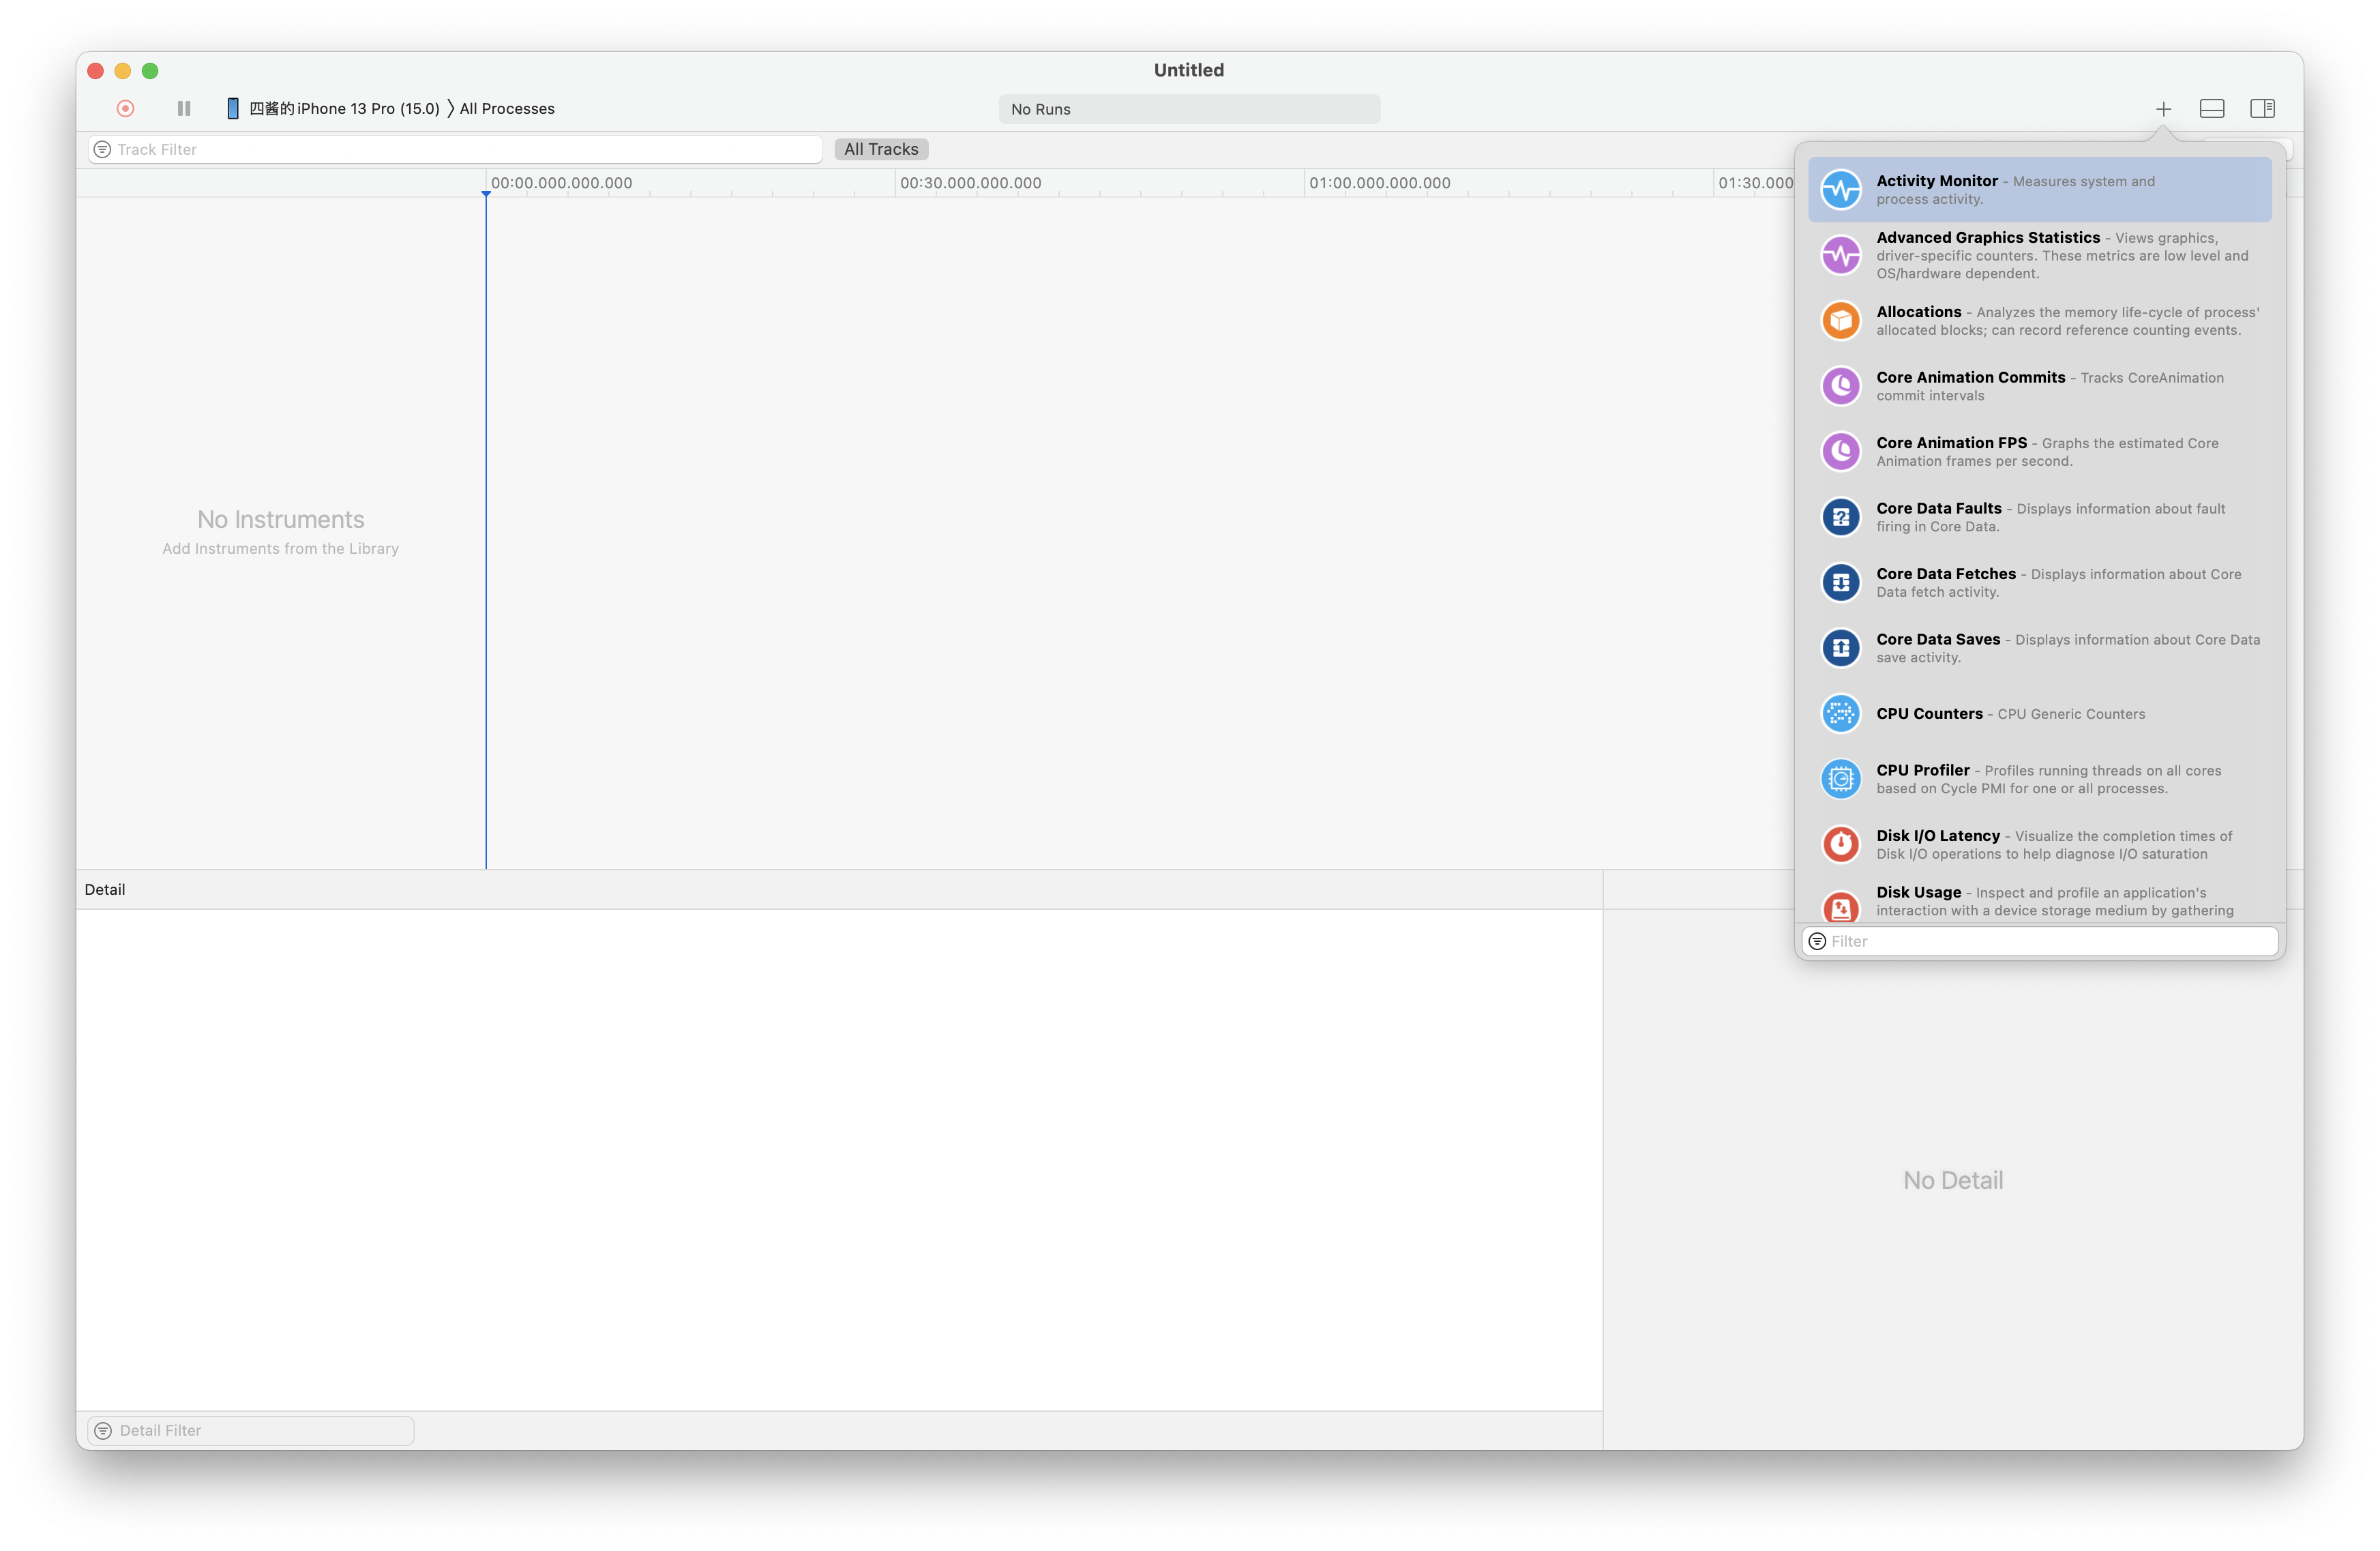
在分析第三方应用的情况下可能会用到的有这几种:
- Activity Monitor 用于查看系统程序的活动信息, 可采集
CPU占用 内存使用 网络使用 磁盘使用 - Core Animation FPS 用于查看当前视图的帧数. 可采集
FPS GPU占用 - CPU Counters 用于采集
CPU占用 的细节, 可分CPU核心采集占用率 - Display 用于查看显示渲染细节. 可采集
帧时间
由于 iOS的 bug, 在 iPhone上, 目前 Core Animation 的FPS上限被限制在了 60 而无法采集到正确的数据, 所以对 iPhone 13 系列的高刷判断需要使用 Frame Time
选择需要的采集器并准备开始采集
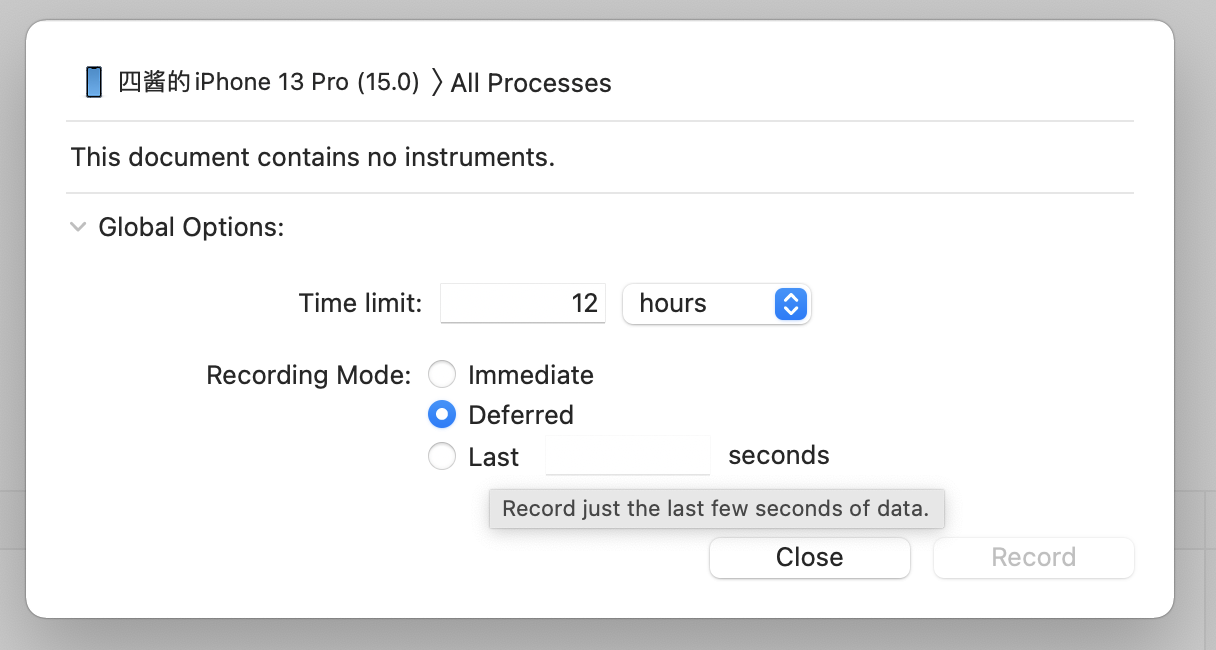
注意: 如果需要采集大量数据, 最好将 Recording Mode 从 Immediate 切换为 Defered. 选择 File -> Recording Options -> Global Options 选中 Defered 即可.
测试采集了一点 Display 数据测试
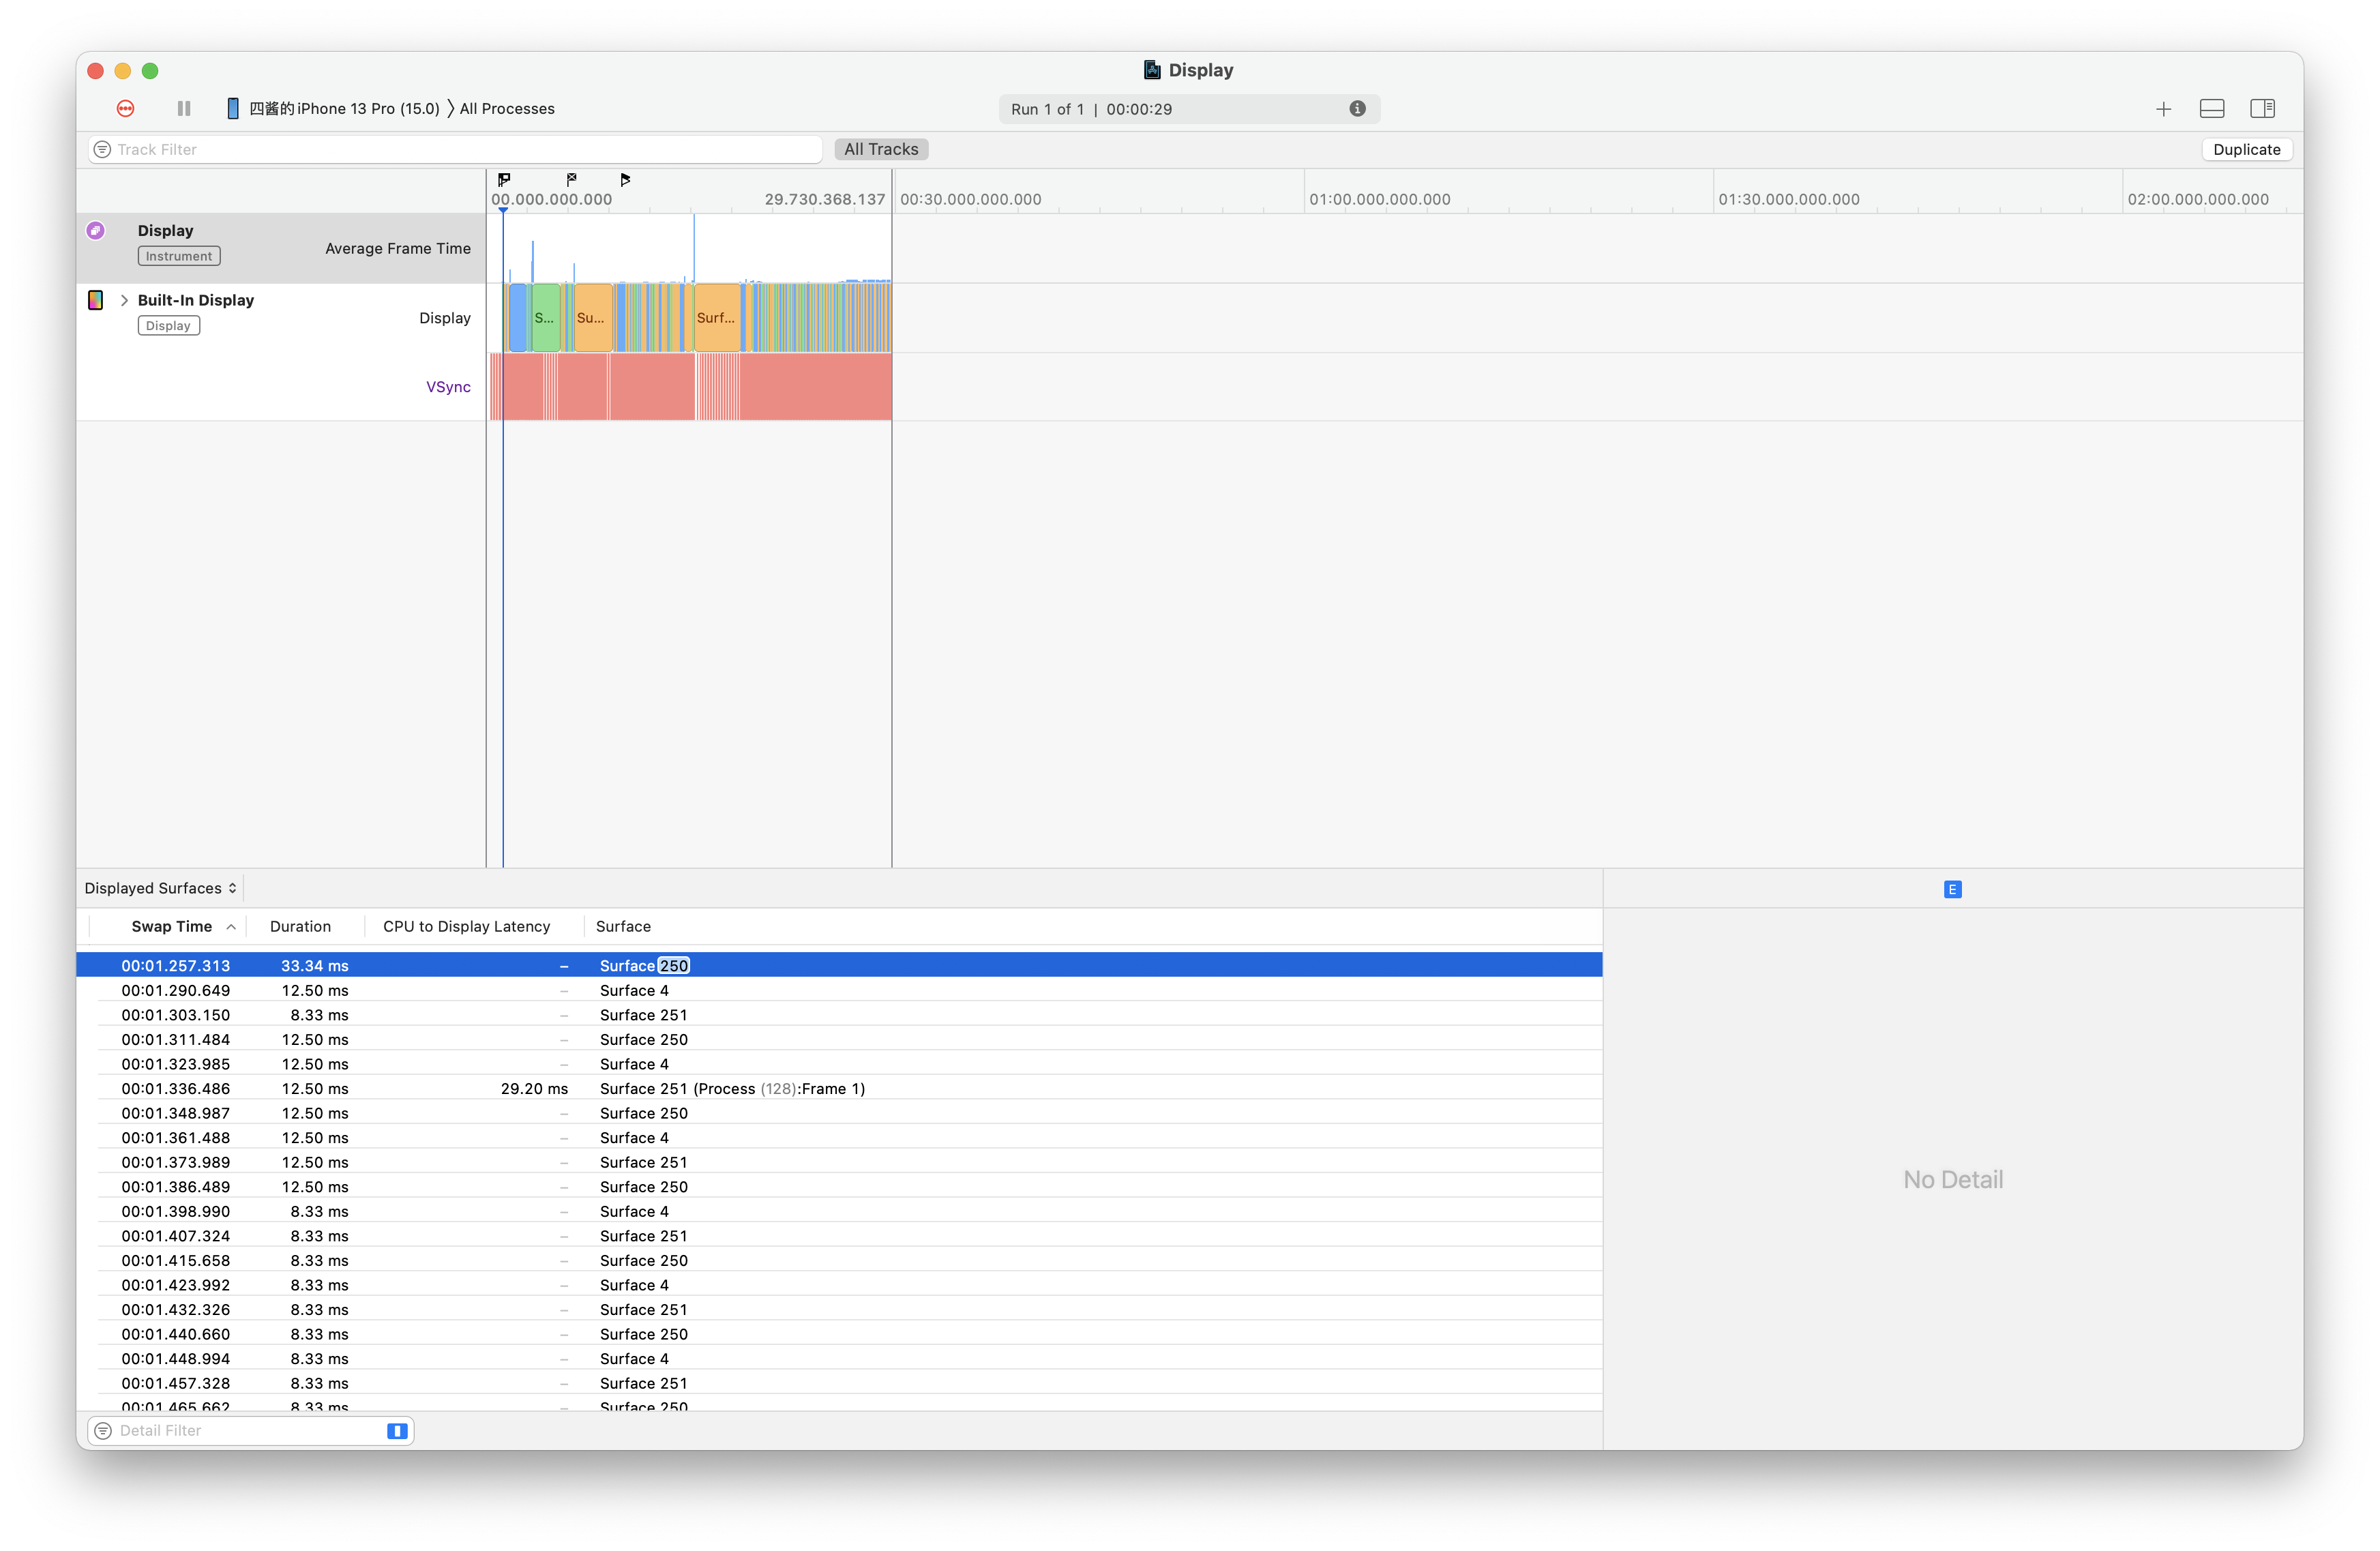
可以看到 ProMotion在 120hz(8.33ms) 80hz(12.5ms) 30hz(33.3ms) 的切换非常迅速
导出数据
由于 Xcode 的更新, 原有直接将数据导出 csv 的方法被弃用了, 现在必须使用 xctrace 来对 .trace 文件进行分析导出.
首先使用 File -> Save 来将采集到的数据保存到 .trace 包.
在保存的目录运行终端 输入 xcrun xctrace export --input "xx.trace" --toc 命令来查看 .trace 文件的概要:
1
2
3
4
5
6
7
8
9
10
11
12
13
14
15
16
17
18
19
20
21
22
23
24
25
26
27
28
29
30
31
32
33
34
35
36
37
38
39
40
41
42
43
44
45
46
47
48
49
50
51
52
53
54
55
56
57
58
| <?xml version="1.0"?>
<trace-toc>
<run number="1">
<info>
<target>
<device uuid="****" model="iPhone 13 Pro" name="iPhone 13 Pro" os-version="15.0 (19A346)" platform="iOS"/>
<host-device uuid="****" model="MacBook Pro" name="MacBook Pro" os-version="11.6 (20G165)" platform="macOS"/>
<all-processes/>
</target>
<summary>
<start-date>2021-09-29T18:53:09.462+08:00</start-date>
<end-date>2021-09-29T18:53:39.193+08:00</end-date>
<duration>29.730368</duration>
<end-reason>User pressed Stop</end-reason>
<instruments-version>13.0 (13A233)</instruments-version>
<template-name>Blank</template-name>
<recording-mode>Immediate</recording-mode>
<time-limit>12 hours</time-limit>
</summary>
</info>
<data>
<table schema="displayed-surfaces-per-second"/>
<table codes=""0x85,0xAF"" schema="kdebug"/>
<table codes=""0x85,0x20" "0x31,0x80"" schema="kdebug"/>
<table schema="metal-gpu-info"/>
<table schema="metal-command-buffer-frame-assignment"/>
<table codes=""0x31,0xb0" "0x31,0xd0"" schema="kdebug"/>
<table schema="metal-command-buffer-completed"/>
<table content="metal-connections" schema="visual-connection" target-pid="ALL"/>
<table schema="metal-ar-events"/>
<table codes=""0x85,0x9" "0x85,0x18"" schema="kdebug" callstack="user"/>
<table track-id-base="2000" schema="metal-object-dependency-chain-display"/>
<table schema="metal-known-compositor-process"/>
<table schema="metal-xr-events"/>
<table codes=""0x85,0xc0" "0x85,0xc1" "0x31,0xca"" schema="kdebug"/>
<table codes=""0x85,0x30"" schema="kdebug"/>
<table schema="display-events-interval"/>
<table codes=""0x85,0x2"" schema="kdebug" callstack="user"/>
<table codes=""0x85,0x1" "0x85,0x8"" schema="kdebug" callstack="user"/>
<table schema="device-display-info"/>
<table schema="metal-xr-intervals"/>
<table schema="device-gpu-info"/>
<table schema="display-surface-swap"/>
<table schema="display-vsyncs-interval"/>
<table content="metal-connection-chains" schema="visual-chain" target-pid="ALL"/>
<table schema="metal-io-surface-access"/>
<table schema="metal-visual-highlight-chain-display"/>
<table schema="display-surface-queue"/>
<table schema="time-info"/>
<table schema="tick"/>
<table schema="displayed-surfaces-interval" target-pid="ALL"/>
</data>
<tracks>
<track name="Display"/>
</tracks>
</run>
</trace-toc>
|
这里我只跑了一次, 所以只有一个 run 标签 number 为 1
在 /trace-toc/run[@number="1"]/data 下有一些 table 标签.
因为 .trace 文件内部使用 sqlite 储存的采集数据, 这里就相当于查询对应表格了. 这里我们要查询的 Displayed Surfaces 在 displayed-surfaces-interval表.
输入命令 xcrun xctrace export --input "Display.trace" --xpath '/trace-toc/run[@number="1"]/data/table[@schema="displayed-surfaces-interval"]' >> display.xml将表的内容输出到 display.xml即导出完成.
结语
由于xctrace 类似于数据库查询工具, 输出的xml基本不是人类可读的. 所以还需要开发一个工具将xctrace的查询结果转换为csv之类的格式方便统计制表. 有时间了我应该会做个小工具处理这个.
不得不说PerfDog的操作是真的开箱即用, 方便快捷. 但 3000¥一年的起步价真的支持不起.